Monitor Microservice
Introduction
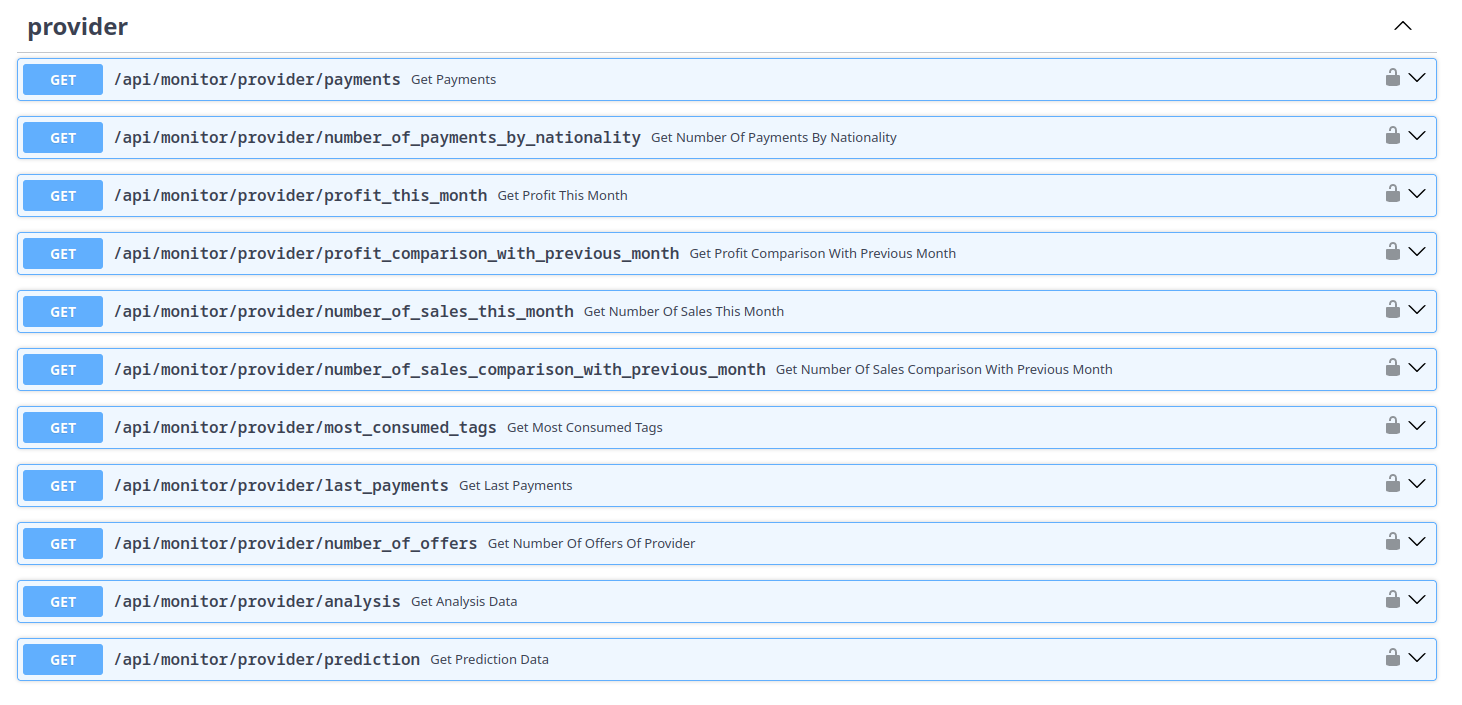
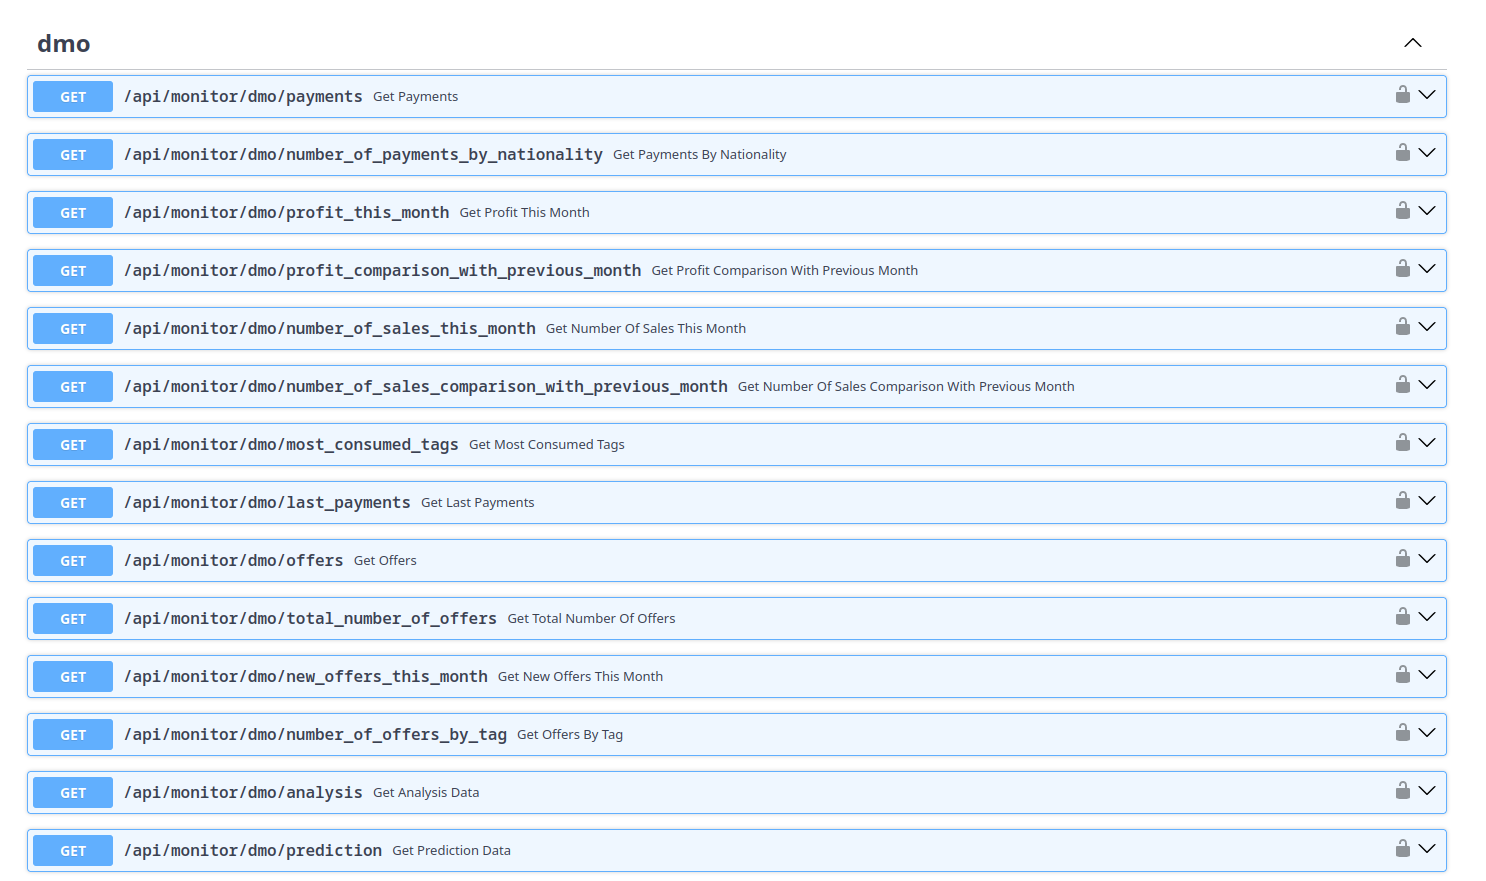
The monitoring microservice is responsible for tracking all interactions and activities within the system, including user behavior and offer purchases. It collects and stores this data for analysis and reporting purposes, providing valuable insights into user engagement. This microservice interacts with other microservices to capture relevant data points and ensure comprehensive monitoring coverage. It was implemented using FastAPI and MongoDB for the database, working as a data warehouse. Here is where the prediction module is also located and it is responsible for predicting tourism trends and user preferences based on historical data and current trends.
Prediction
Our future data prediction feature utilizes a combination of Google Trends analysis and historical payment data stored in the data warehouse to forecast the number of payments or profit per month or day for the upcoming 3 months/days. In our Monitor microservice, there is an endpoint that allows users to request predictions by passing parameters to specify whether they want to predict the number of payments or profit, and whether the prediction should be made on a monthly or daily basis. It calls a function to obtain future value predictions using the relevant historical data of our data warehouse and the Google Trends data for the topic ”Aveiro”. Historical values are obtained from fourfunctions (get num payments by month, get num payments by day, get profit by month, and get profit by day) responsible for extracting historical data from the data warehouse. They use MongoDB aggregation pipelines to filter and group data by month or day, calculating the total number of payments or accumulated profit during this period. To obtain the trends from Google Trends for the topic ”Aveiro,” we are using the serpapi library to query Google Trends and retrieve interest-over-time data for a specific search term and date range.
To calculate future data, the average slope and average intercept of the last 3 points are calculated, which could be the last 3 days or the last 3 months depending on the request, both from the Data Warehouse’s historical data and for Google Trends’ trends for the topic ”Aveiro”. The calculation of the 3 future points,
y(d) = (avgSlope ∗ d + avgB) + log(trendAvgSlope ∗ d + trendAvgB)
where d is one of the next 3 future points, avgSlope is the average slope and avgB is the average intercept of the last 3 points from the Data Warehouse data, trendAvgSlope is the average slope and trendAvgB is the average intercept of the last 3 points from Google Trends data, and y(d) is the predicted value for a future point d.
API Endpoints